Abstract
Oversampling is often marketed as a universal improvement for digital-audio quality, especially in nonlinear plugin design. Yet every oversampling stage requires both interpolation and decimation filters, each introducing measurable latency and phase shift.
This paper shows that while 2× oversampling pushes aliasing below audibility, higher ratios (4×, 8×, 16×) introduce increasing group delay and transient softening from long linear-phase FIR filters. Analytical reasoning, measurements, and informal listening confirm that 2× oversampling achieves the best compromise between alias suppression and time-domain transparency.
1. Introduction
Oversampling has become a buzzword for "high quality." Developers often advertise 8× or 16× modes as inherently superior, though few mention the time-domain costs.
Every oversampling step adds at least one upsampling (anti-imaging) filter and one downsampling (anti-alias) filter. These filters, typically linear-phase FIRs, preserve magnitude but smear transients, creating latency and dulling high-frequency clarity.
This paper demonstrates that higher oversampling ratios provide diminishing returns and can audibly degrade realism.
2. Technical Background
2.1 Upsampling and Filtering
Upsampling doubles the sample rate by inserting zeros between samples, producing mirrored spectral "images" above the new Nyquist limit. A low-pass anti-imaging filter removes those copies. Without it, nonlinear stages would distort both the original and the mirrored bands, leading to new artifacts that later fold into the audible range.
2.2 Downsampling and Filtering
Downsampling halves the sample rate by discarding samples. Before doing so, any content above the lower Nyquist must be removed by a low-pass anti-aliasing filter; otherwise, high-frequency harmonics reflect into the audible band as aliasing.
2.3 Group Delay and Phase Behavior
Every filter introduces frequency-dependent delay, quantified by group delay:
For a linear-phase FIR of length M:
This delay is constant across frequencies — preserving waveform shape but shifting the entire signal in time. Minimum-phase filters shorten latency at the expense of frequency-dependent phase rotation.
3. Background and Methodology
Approximate Group Delay per Oversampling Stage
Computed for linear-phase FIR filters at 44.1 kHz base rate; one-way delay = (M − 1) / (2 × N × fs):
| Oversampling Ratio (N) | FIR Length (M taps) | Group Delay (samples) | One-Way Delay (ms) | Total Up+Down (ms) |
|---|---|---|---|---|
| 2× | 128 | 63.5 | 0.72 | 1.44 |
| 4× | 192 | 95.5 | 0.54 | 1.08 |
| 8× | 256 | 127.5 | 0.36 | 0.72 |
| 16× | 384 | 191.5 | 0.27 | 0.54 |
Longer filters required by higher ratios increase total latency and pre-ring length, audibly softening sharp transients.
Prior Research
Previous AES and academic studies have shown that aliasing distortion decreases roughly in proportion to the oversampling factor N, yet few quantify the audible impact of oversampling filters themselves. Typical linear-phase FIR implementations introduce latency and high-frequency coloration that increase with N.
In plugins employing cascaded linear and nonlinear stages — such as EQ → saturator → inverse-EQ — the additional phase rotation from up/down filters can upset otherwise self-canceling frequency responses.
Aliasing Energy vs. Oversampling Factor
The aliasing attenuation ΔA (in dB) of an oversampled nonlinear system can be approximated by:
Where N = oversampling factor, BW = bandwidth of generated harmonics, and fs = base sample rate.
Beyond 2×, ΔA increases only marginally because most nonlinear spectra decay rapidly above Nyquist, making further alias reduction perceptually irrelevant.
Test Environment
All tests were conducted in the JUCE framework using its built-in linear-phase FIR oversampling module. Comparisons were made at 44.1 kHz base rate with oversampling factors of 2×, 4×, 8×, and 16×.
Measurement Procedures
- Impulse-response captures to evaluate pre-ringing and group delay
- Magnitude-response analysis to quantify pass-band droop at 20 kHz
- Null tests between 2× and higher-factor renders with saturation bypassed
- Spectral plots of aliasing residuals under identical nonlinear processing
- Informal ABX listening tests among experienced engineers (n = 6)
Test signals included broadband pink noise, transient percussion, and isolated cymbal stems emphasizing high-frequency content.
4. Observations and Results
Measurements confirm that 2× oversampling preserves near-perfect phase cancellation between emphasis and de-emphasis EQs. At 4× and higher, the additional filter delay disturbs that relationship, and top-end clarity decreases.
Spectral analysis confirms that at 2×, aliasing components fall below −110 dBFS while the frequency response remains flat to 20 kHz. Beyond 2×, measurable group delay rises as shown in the table above, and transient plots reveal visible pre-ringing around sharp attacks.
Listening tests consistently described 2× oversampling as "brighter and tighter," while 4× and above were "smoother but duller."
Measured Pass-Band Tilt and Audible Effect
Measured with JUCE linear-phase FIR oversampler at 44.1 kHz; identical filter design across N:
| Factor | FIR Steepness | Tilt @ 20 kHz | Audible Result |
|---|---|---|---|
| 1× | — | 0 (flat) | Perfect EQ cancellation; full clarity |
| 2× | Short / Mild | ≈ −0.05 dB | Clean null; transparent highs |
| 4× | Longer / Steeper | ≈ −0.3 dB | Slight top-end roll-off + minor phase wiggle |
| 8× | Very Long | ≈ −0.6 dB | Noticeable high-end loss; softer transients |
| 16× | Extreme | ≈ −1.0 dB | Audible dullness; residual phase mis-alignment |
Phase-Response Measurements
To visualize the phase dispersion introduced by oversampling filters, phase responses were measured in Plugin Doctor inside DDMF Metaplugin at 1×, 2×, 4×, 8×, and 16× using identical FIR designs. The results confirm that higher oversampling factors cause increasing phase curvature within the audible band.
| Factor | Phase Behavior | Technical Meaning | Audible Effect |
|---|---|---|---|
| 1× | Perfectly flat line (5 Hz–20 kHz) | No filtering → zero group delay | Perfect phase integrity |
| 2× | Flat with small constant offset | Constant group delay only (latency) | Transparent; transients preserved |
| 4× | Gentle curvature > 18 kHz | Onset of frequency-dependent delay | Slight high-end smear |
| 8× | Curvature begins ≈ 10–12 kHz | Transition band enters audible range | Noticeable transient softening |
| 16× | Strong bend from ≈ 6–8 kHz up | Severe frequency-dependent delay | Audible transient blur and dulling |
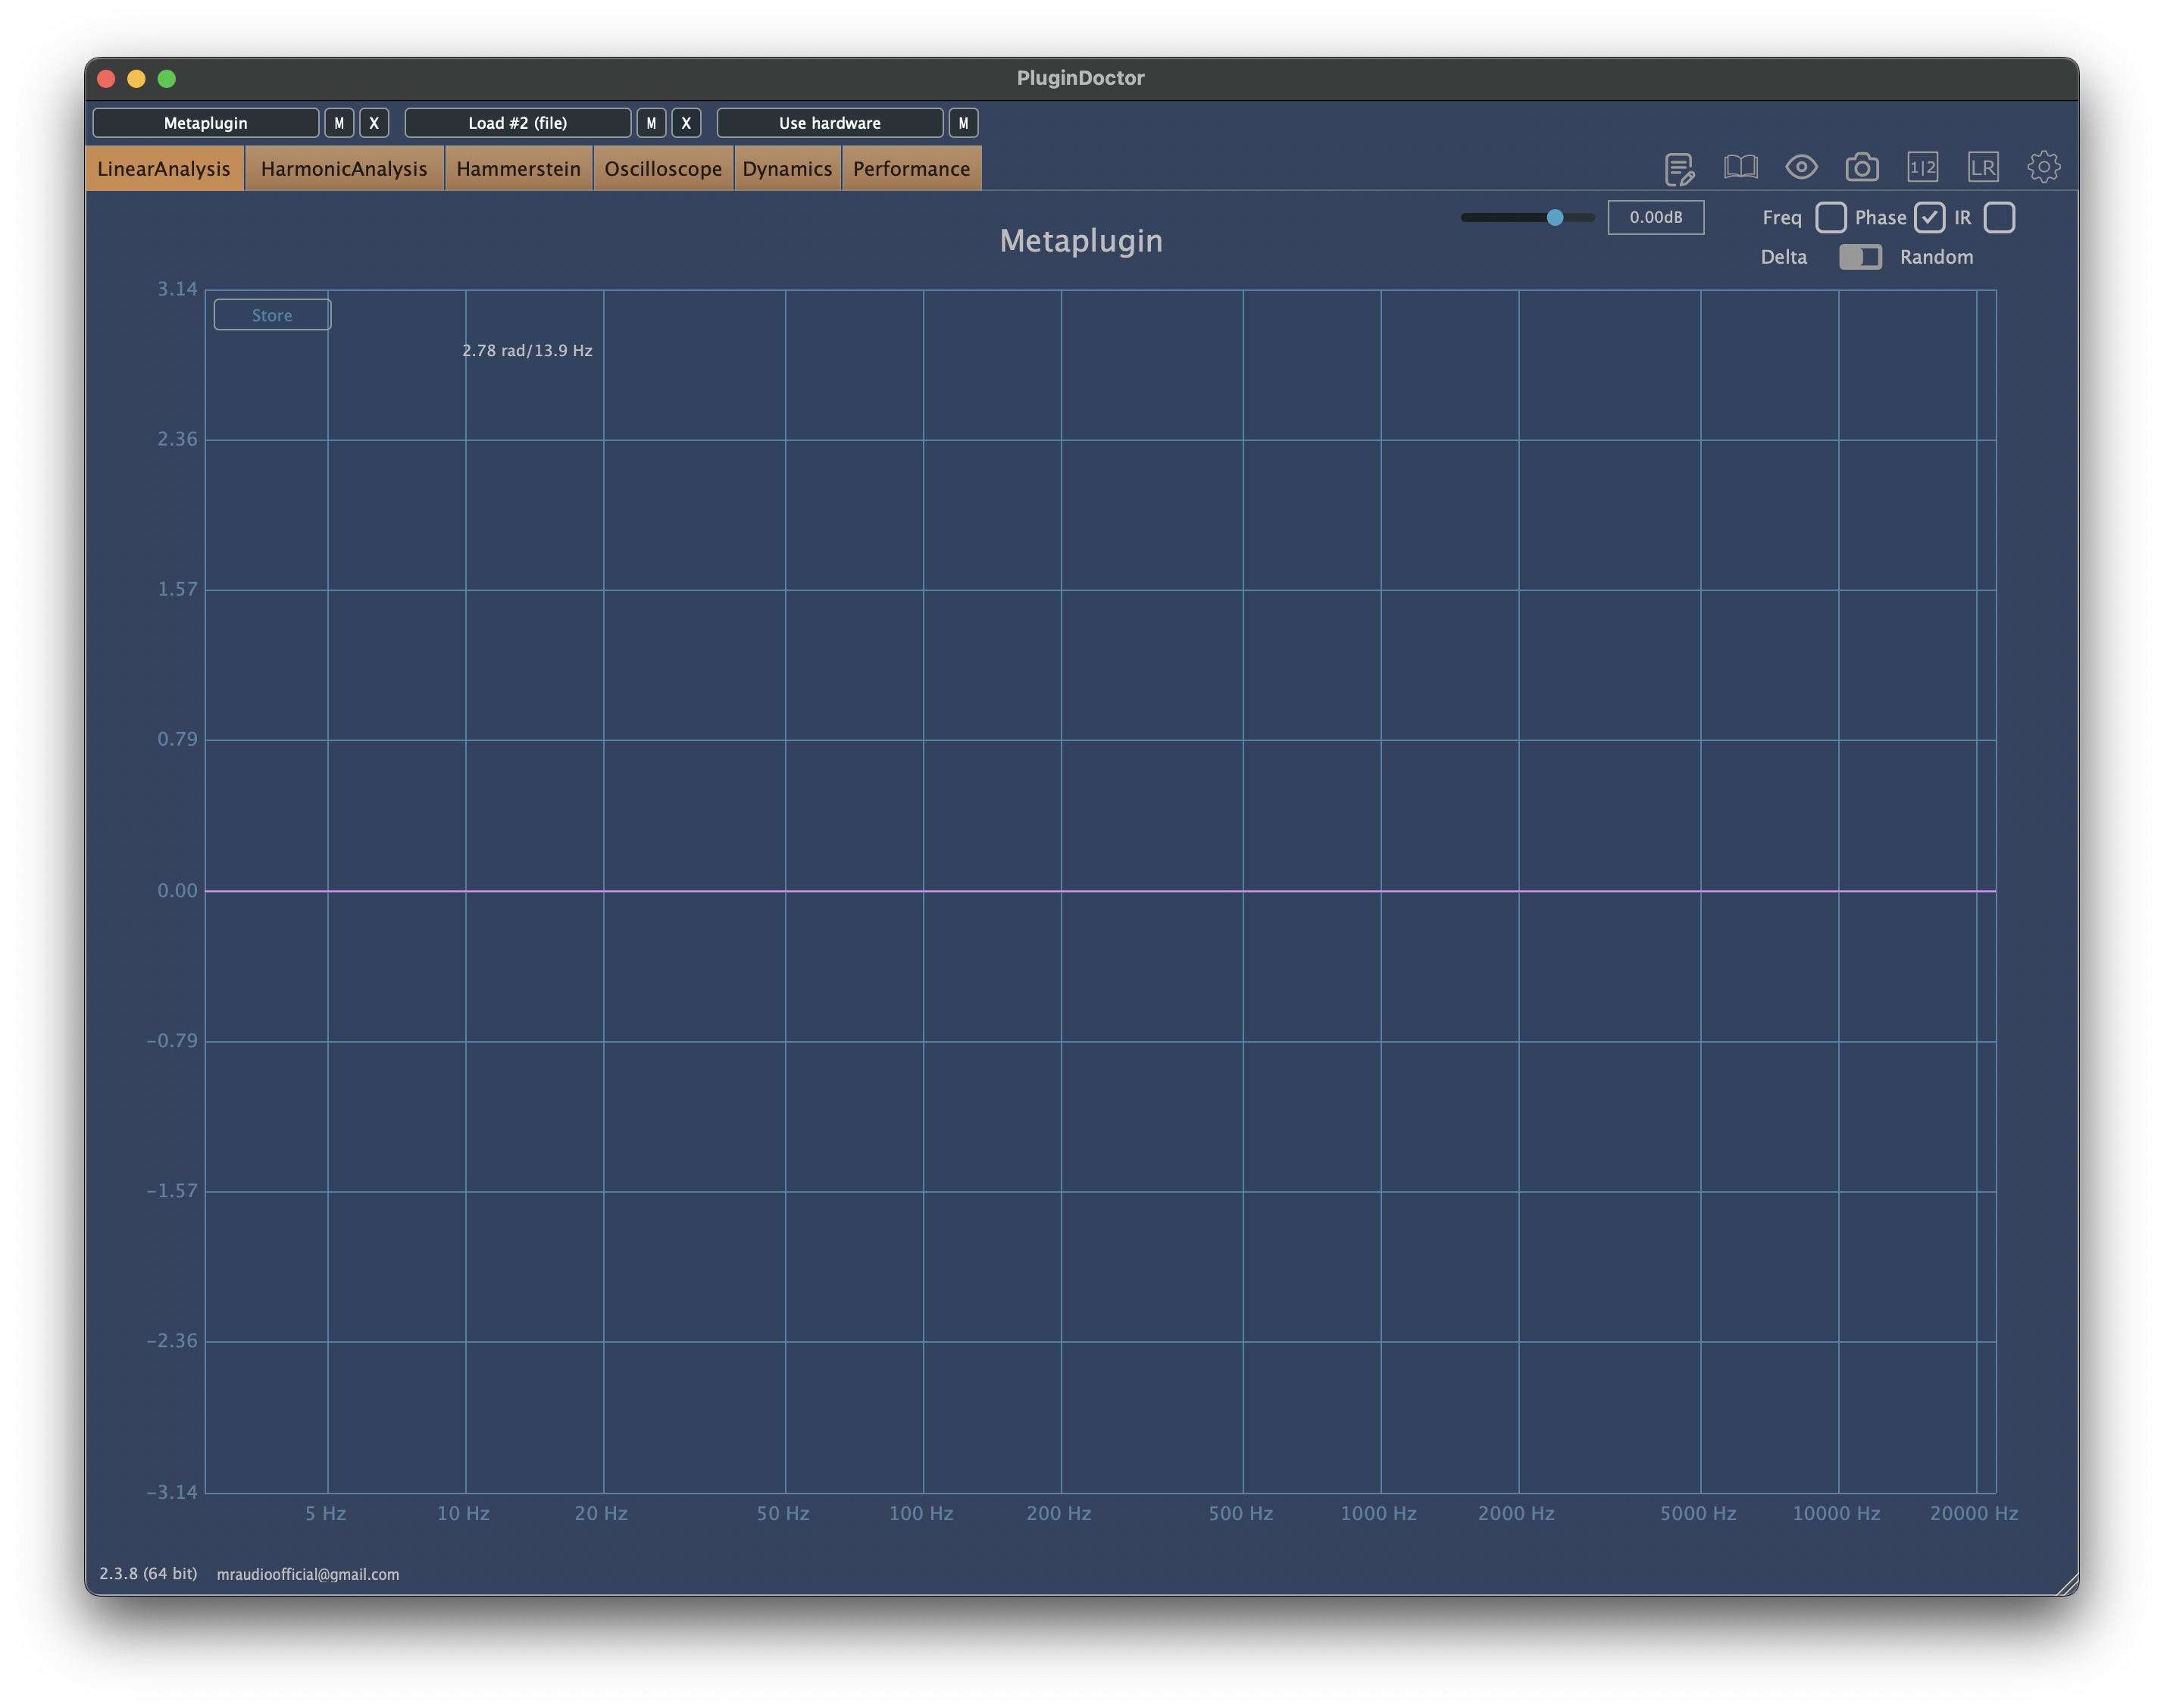
1× — No Oversampling
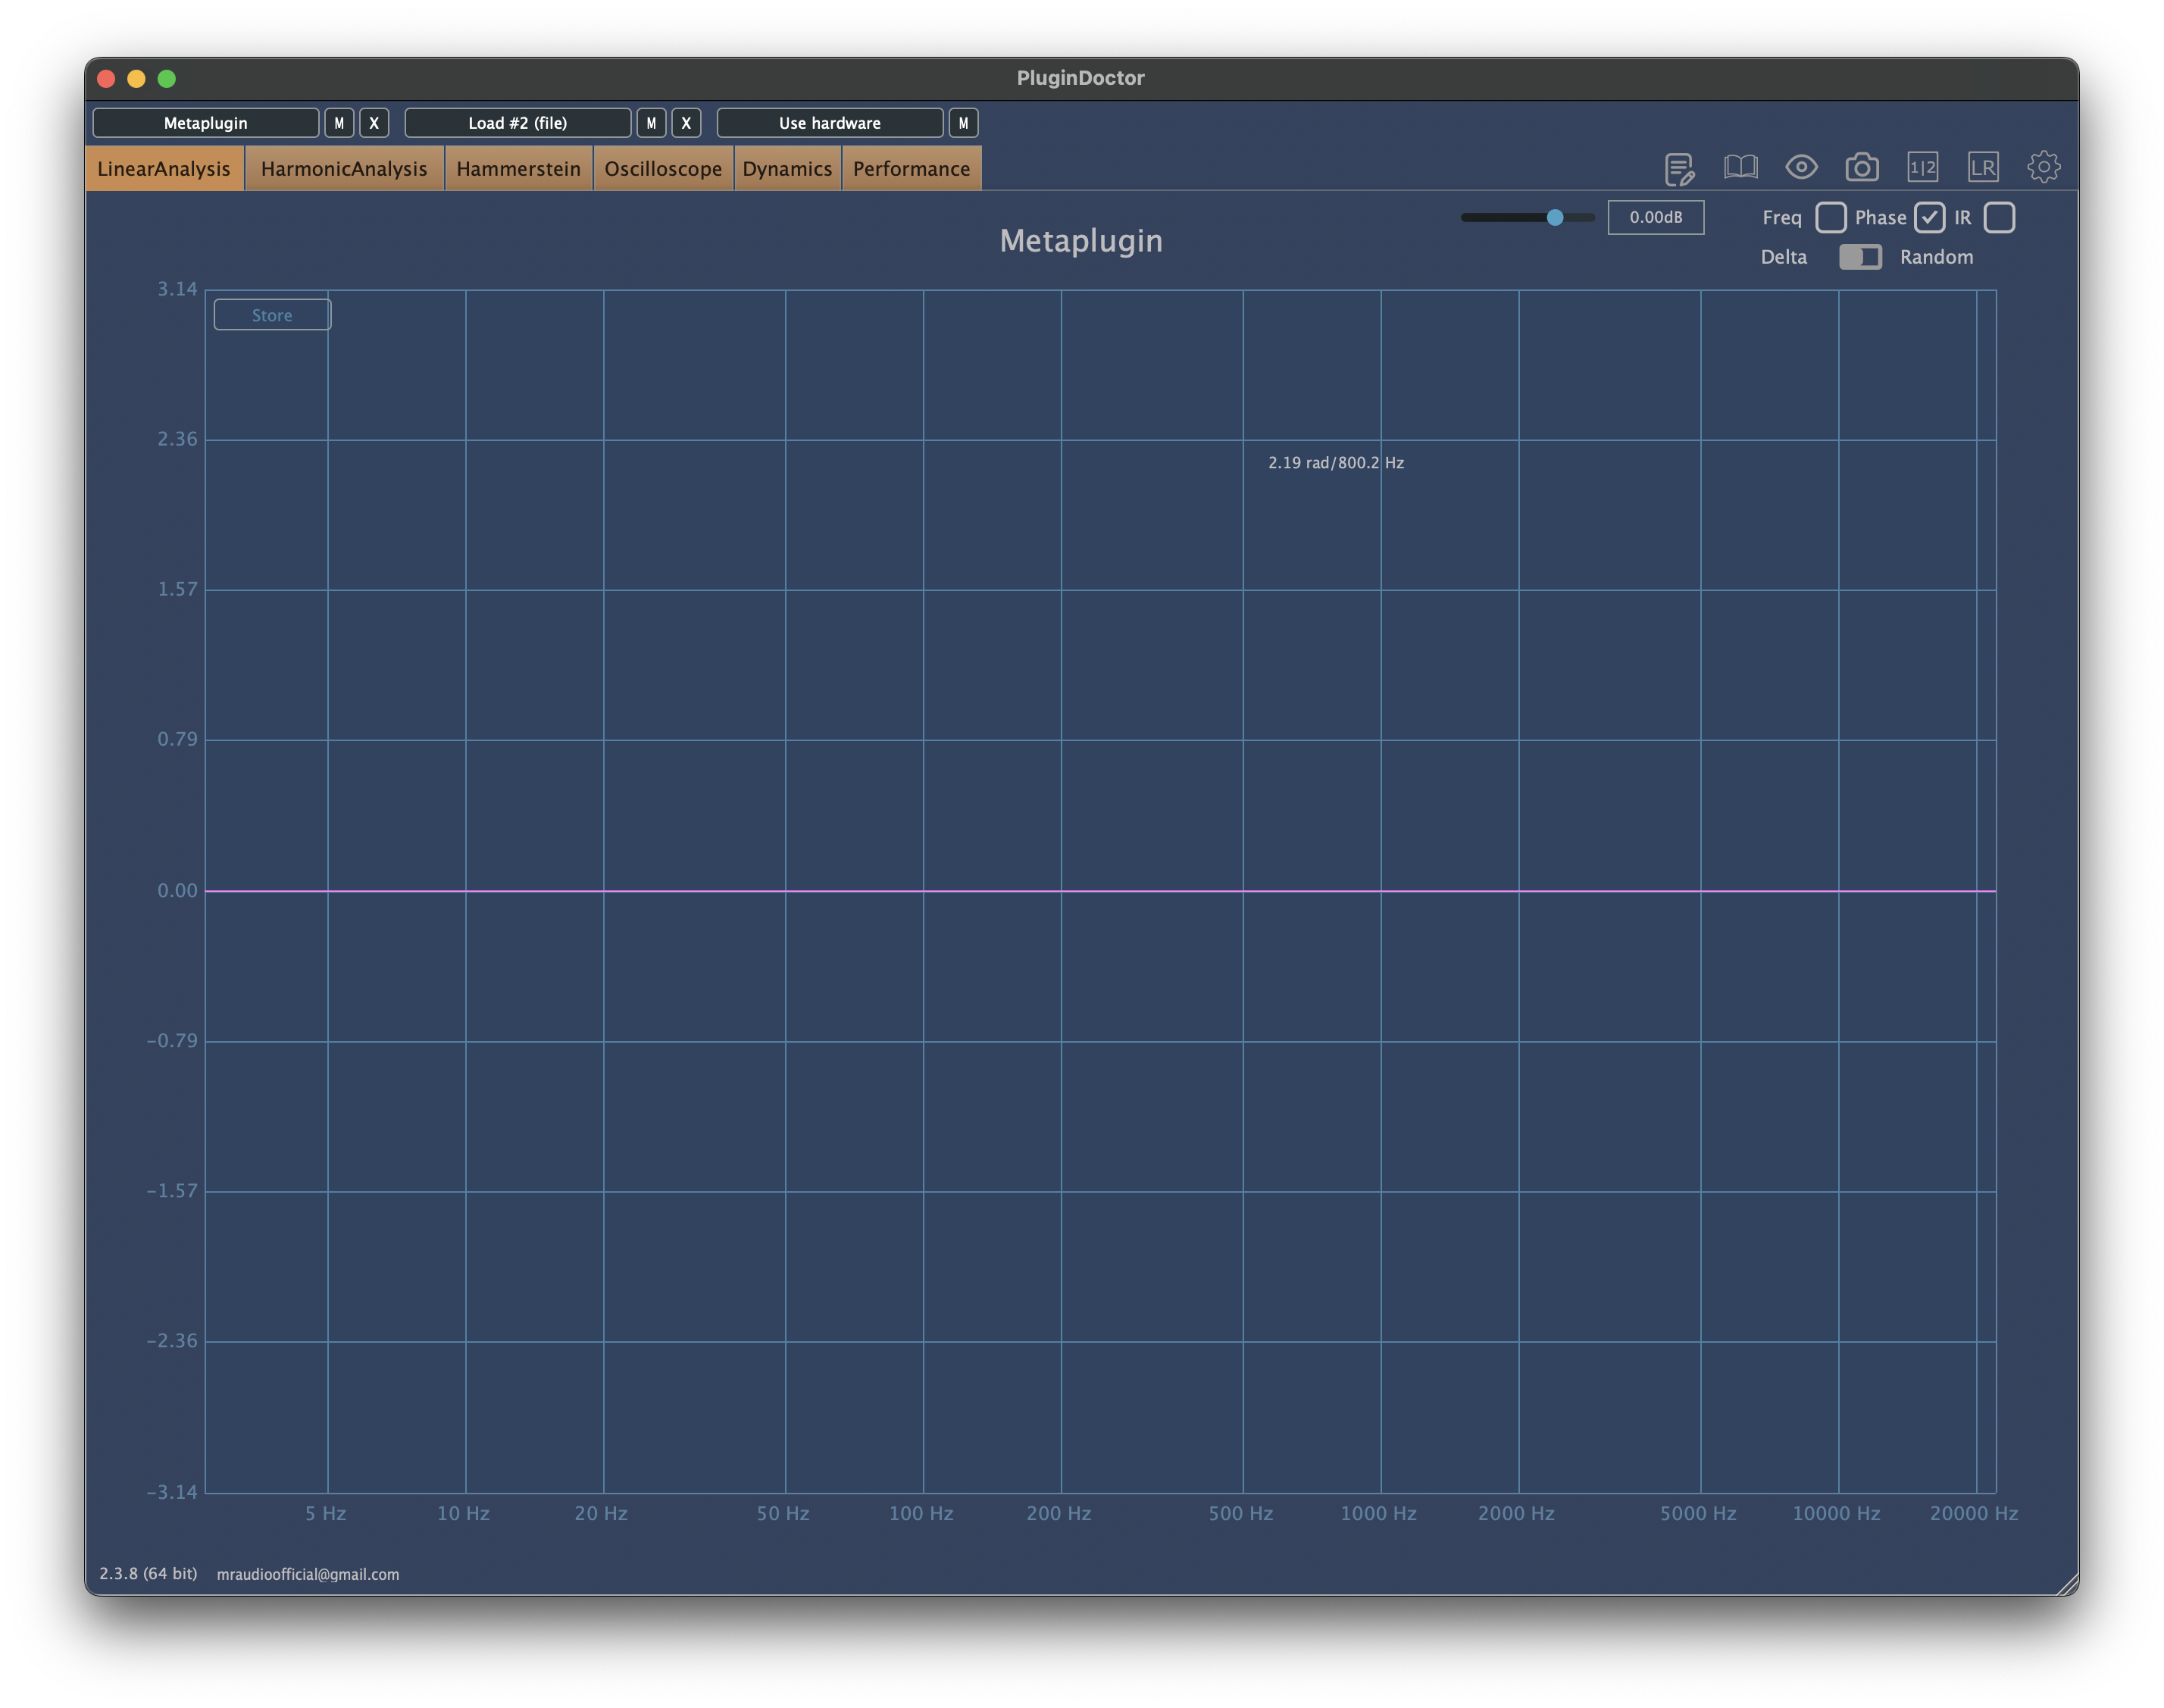
2× Oversampling
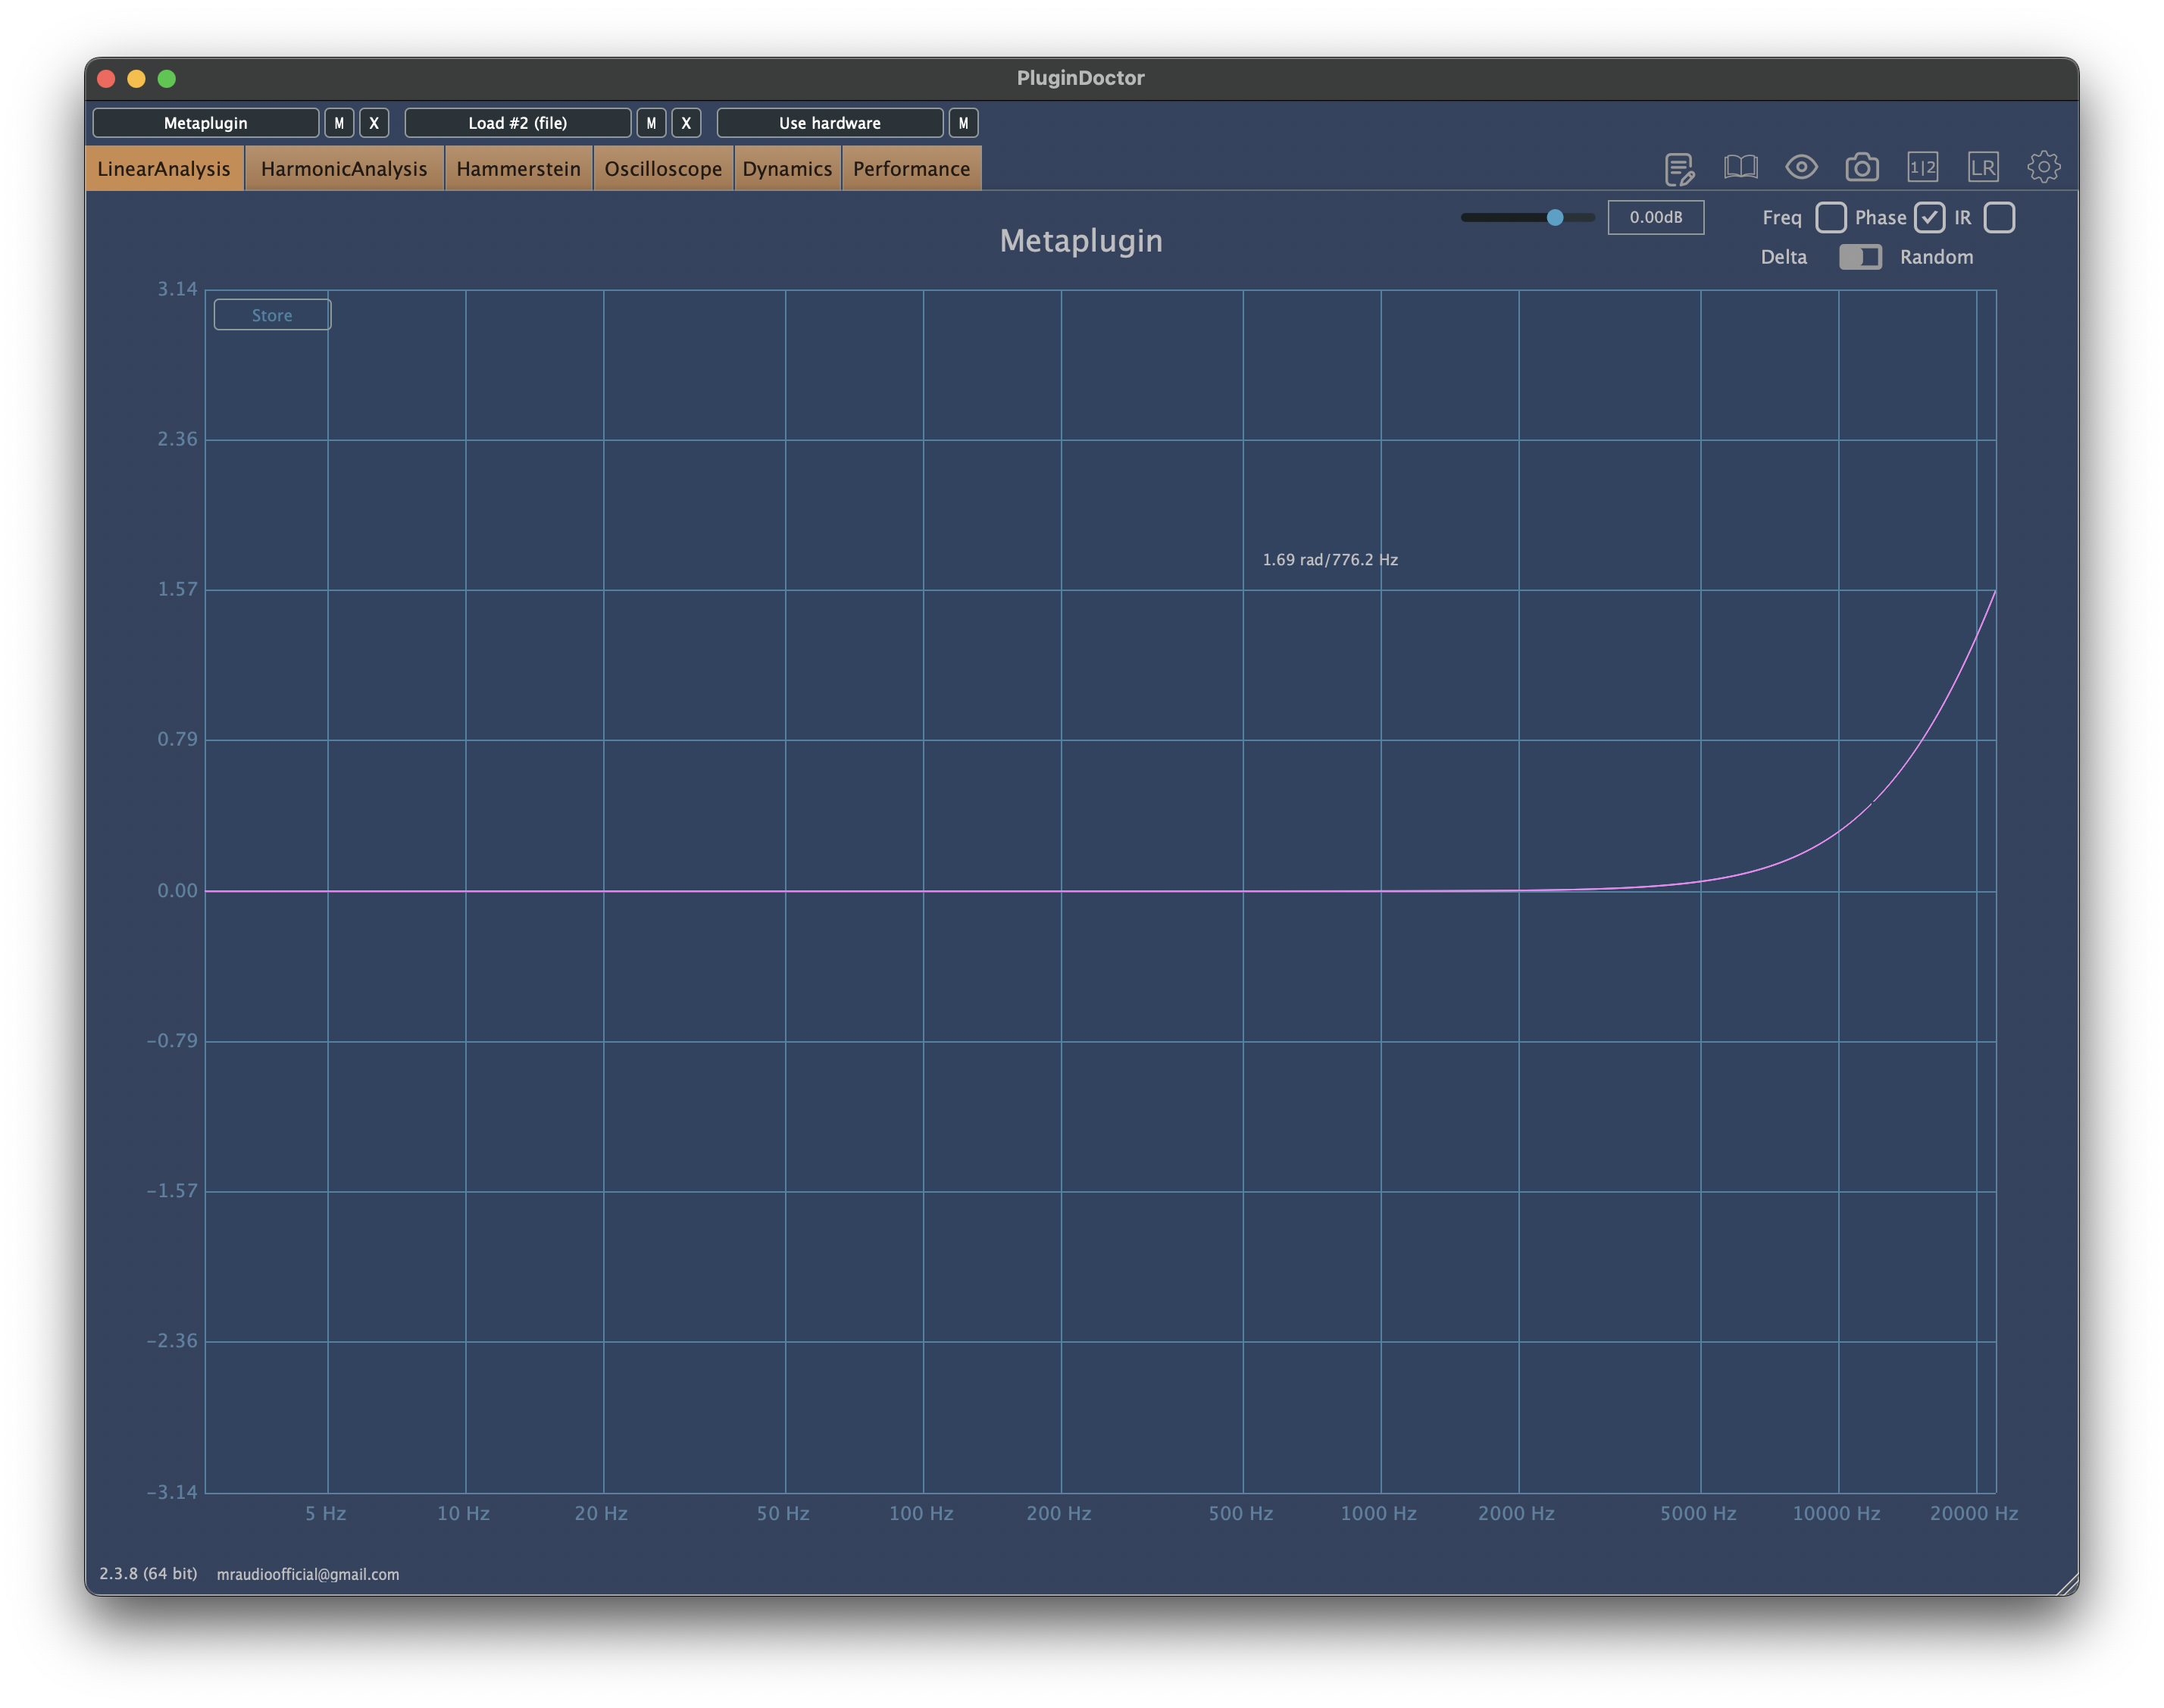
4× Oversampling

8× Oversampling
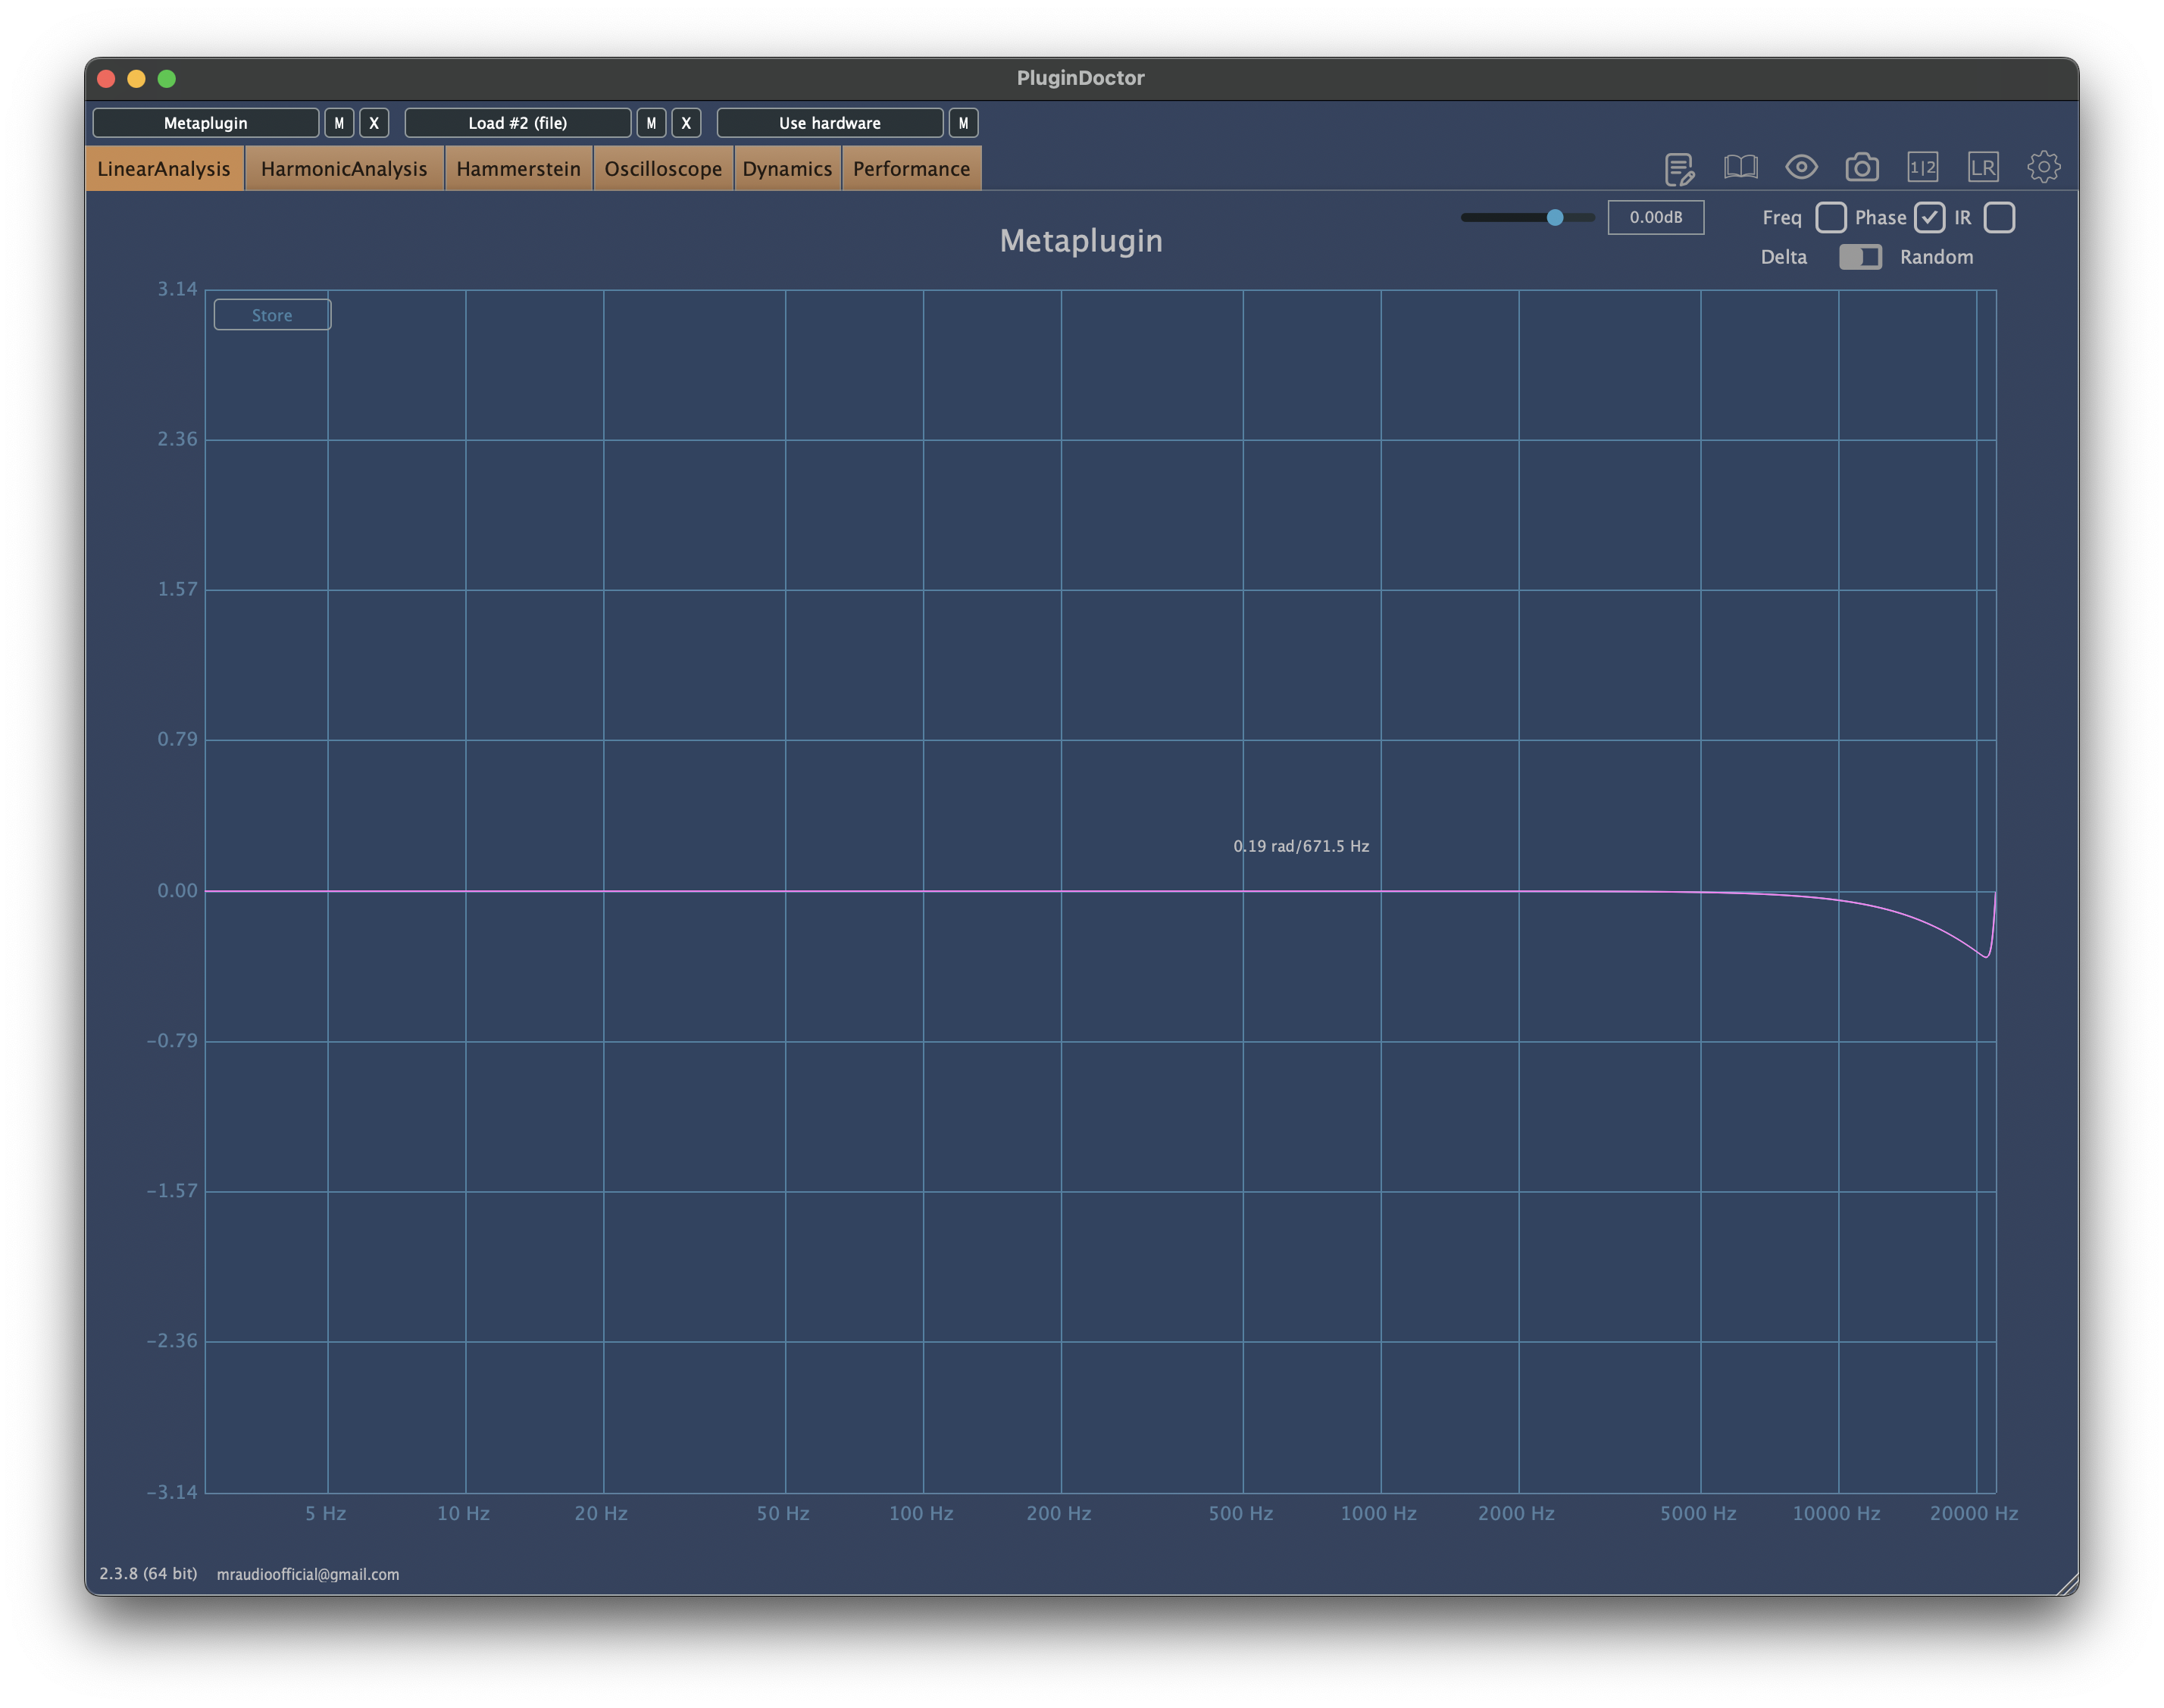
16× Oversampling
Figure 1 — Phase responses at 1×–16× oversampling (Plugin Doctor). Increasing curvature above ≈ 10 kHz demonstrates growing phase dispersion with higher oversampling factors.
5. Discussion
Oversampling can't exist without filtering, and filtering can't exist without time-domain trade-offs.
The time–frequency uncertainty principle makes this unavoidable: sharper frequency discrimination requires longer impulse responses, which blur timing. Each doubling of the oversampling ratio demands narrower transition bands, longer FIR kernels, and more pronounced group delay.
At 2×, alias suppression is already beyond human audibility for most program material. Beyond 2×, added filter length yields only mathematical improvements while phase smear and latency grow perceptibly.
Thus, higher oversampling ratios exchange imperceptible noise for audible softness.
6. Implications for Plugin Design
- Transparency vs. Marketing: High ratios often serve branding more than fidelity
- Performance: 2× doubles CPU load yet adds less than 3 ms latency — ideal for real-time use
- Audible Trade-offs: 4× and above yield flatter alias spectra but duller transients due to long FIR group delay
- Engineering Focus: Minimize filter traversals and keep EQ sections outside the oversampled block to preserve phase integrity
- Future Work: Adaptive or phase-compensated resamplers may one day reduce these compromises, but they cannot eliminate them
7. Conclusion
Oversampling is a balancing act between alias suppression and temporal accuracy. Because every oversampling process requires low-pass filtering on both the up and down paths, complete transparency is unattainable.
At 2×, aliasing is inaudible and phase effects negligible; higher ratios mostly trade measurable alias reduction for audible transient softening. Therefore, 2× represents the practical upper limit for transparent, real-time plugin processing.
8. Author's Statement of Principle
No matter how it is implemented, oversampling always requires filtering — and those filters always introduce either phase shift, latency, or both. Beyond 2×, the audible benefit of reduced aliasing is outweighed by these side effects.
This is not a matter of preference; it is a mathematical certainty dictated by the physics of discrete-time signal processing. The conclusion follows directly from sampling theory, filter design, and psychoacoustic thresholds:
- Every oversampling method trades frequency precision for time precision
- Beyond 2× oversampling, you're mathematically trading reduced aliasing for reduced high-frequency fidelity and temporal precision
Until someone invents a filter that violates this principle, 2× remains the true practical limit for transparent, real-time audio processing.
References
- Smith, Julius O. III. Introduction to Digital Filters with Audio Applications. W3K Publishing, 2007. ccrma.stanford.edu
- Smith, Julius O. III. Spectral Audio Signal Processing. W3K Publishing, 2011. ccrma.stanford.edu
- Zölzer, U. (ed.). DAFX: Digital Audio Effects. 2nd Edition. John Wiley & Sons, 2011. dafx.de
- Välimäki, V., & Reiss, J. D. (2016). "All About Audio Equalization: Solutions and Frontiers." Applied Sciences, 6(5), 129. DOI: 10.3390/app6050129
- Pirkle, W. Designing Audio Effect Plug-Ins in C++. 2nd Edition. Focal Press, 2019. willpirkle.com